 By peter_lzh
 SenseNova U1 Infographic-V3: A Stunning Open-Source Infographic Generation and Editing Model
SenseTime has officially released SenseNova U1 Infographic Enhanced V3 (SenseNova-U1-8B-MoT-Infographic-V3, or Infographic-V3 for short). It keeps V2’s strong infographic generation ability and — for the first time — adds infographic editing: when the overall image is already good, you no longer have to start over; you simply refine the local text or the overall style.
Model weights: huggingface.co/sensenova/SenseNova-U1-8B-MoT-Infographic-V3
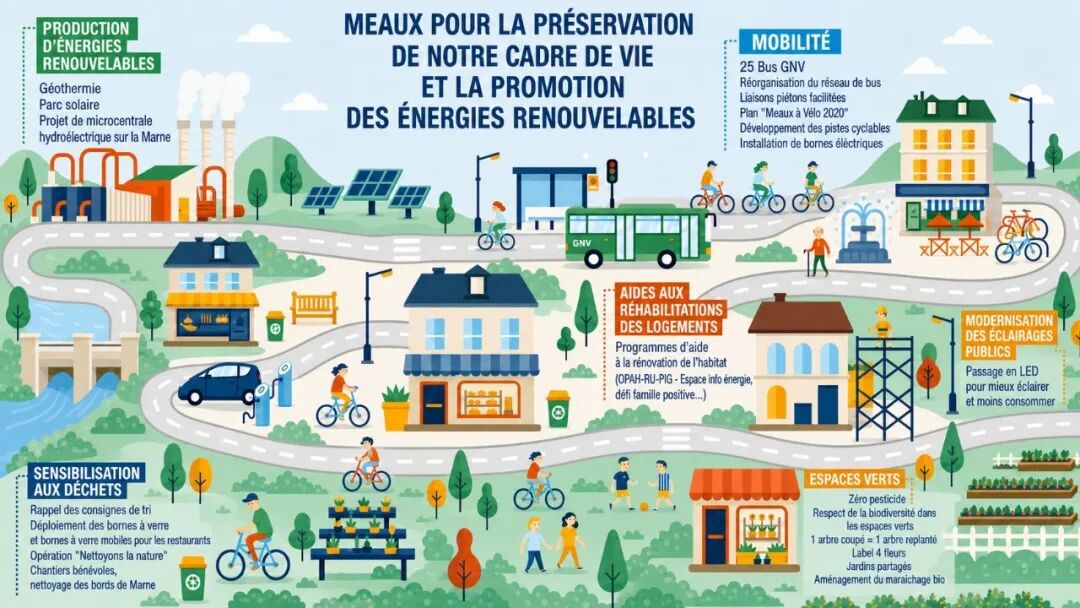
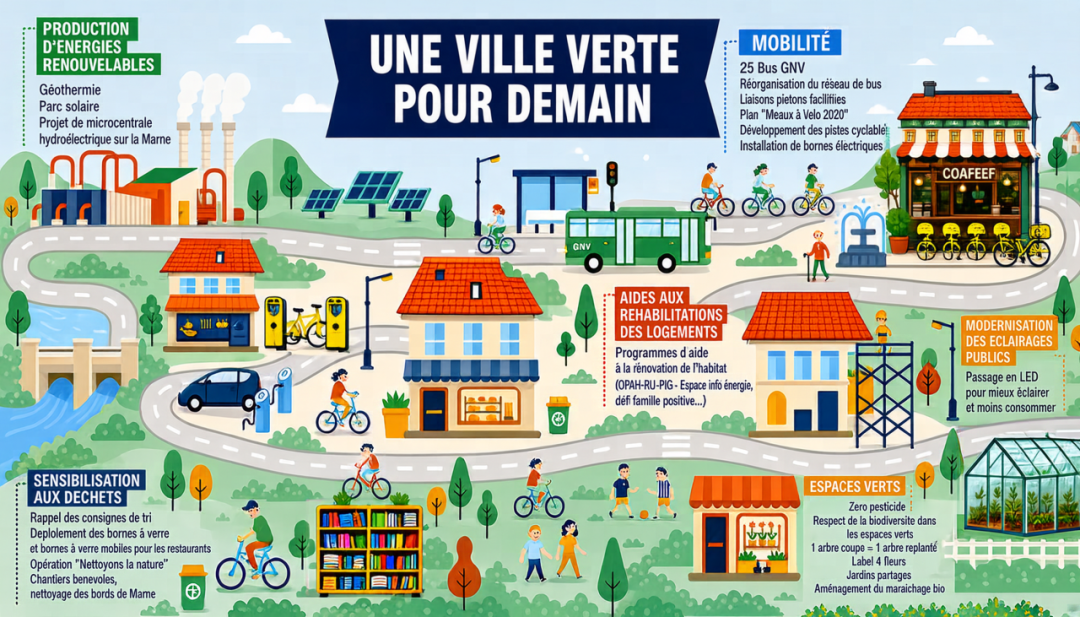
From “regenerate” to “edit on demand”
In high-information-density scenes, small local fixes — a typo, an icon tweak, a content addition — are almost impossible to avoid. A single text error can make the whole image unusable, forcing users to regenerate and “re-roll” repeatedly. Infographic-V3 raises the bar on delivering usable, structured visual content straight from text-to-image fusion.

Local text editing
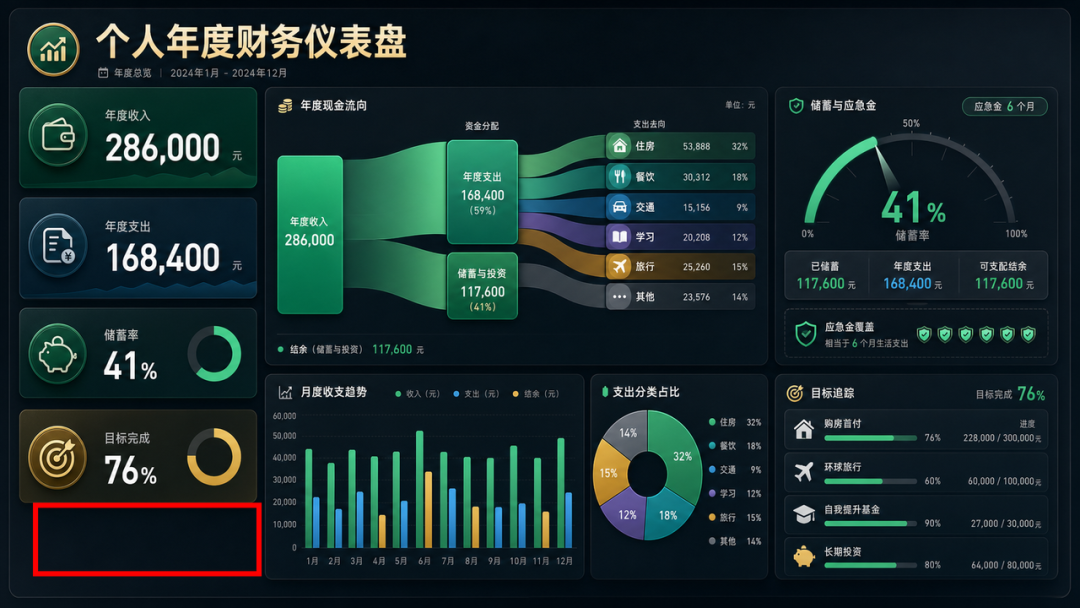
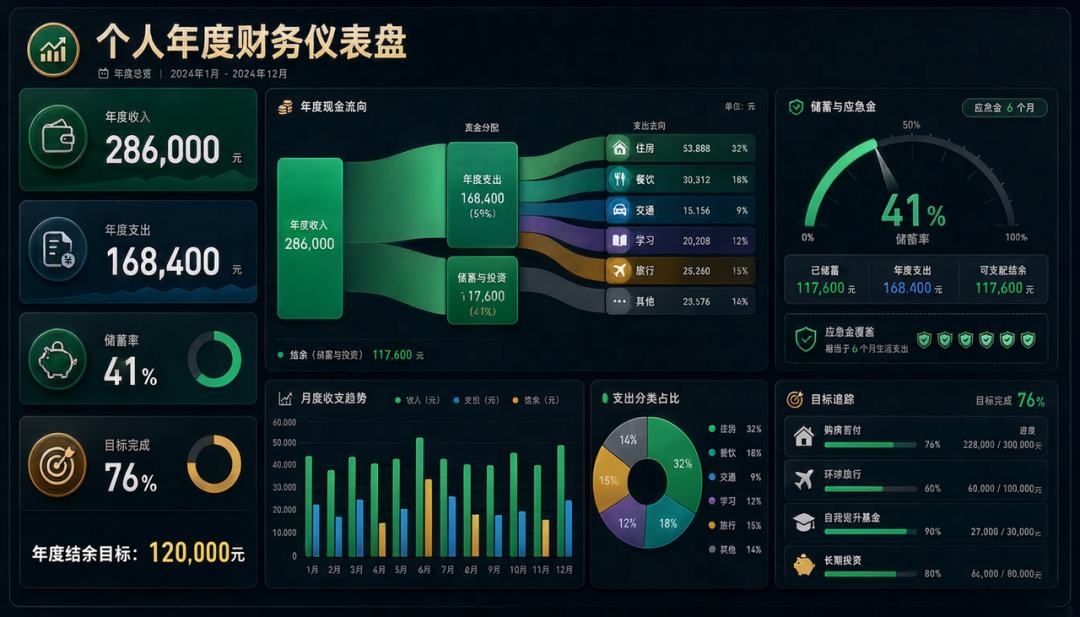
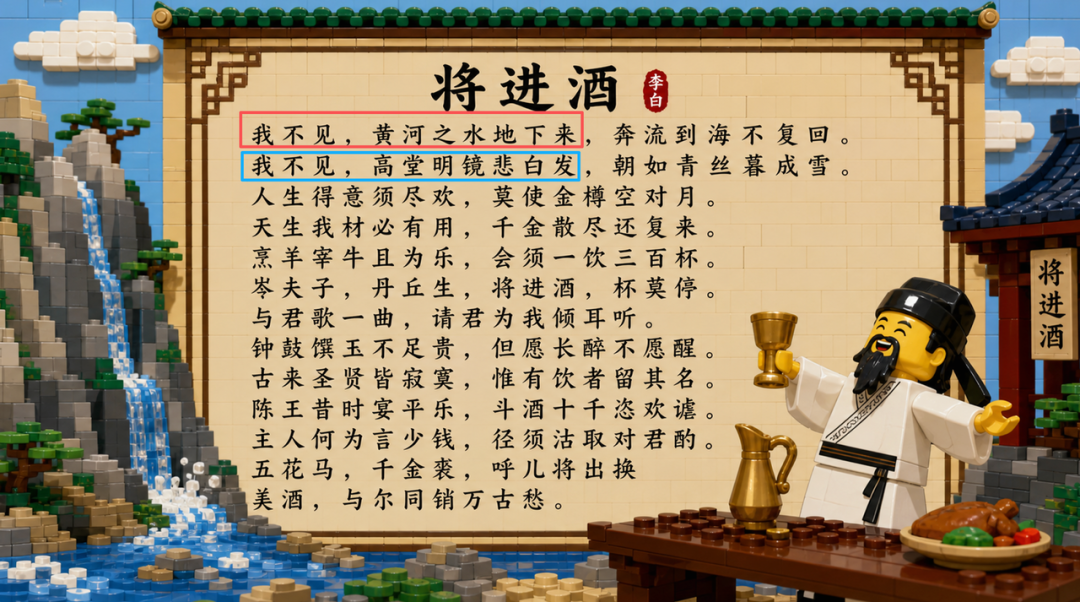
Infographic-V3 supports several editing modes. You can mark a target region for a pinpoint edit, or simply describe the change in natural language. For typos, missing, or duplicated characters it preserves the original layout, illustrations, and visual structure as much as possible.

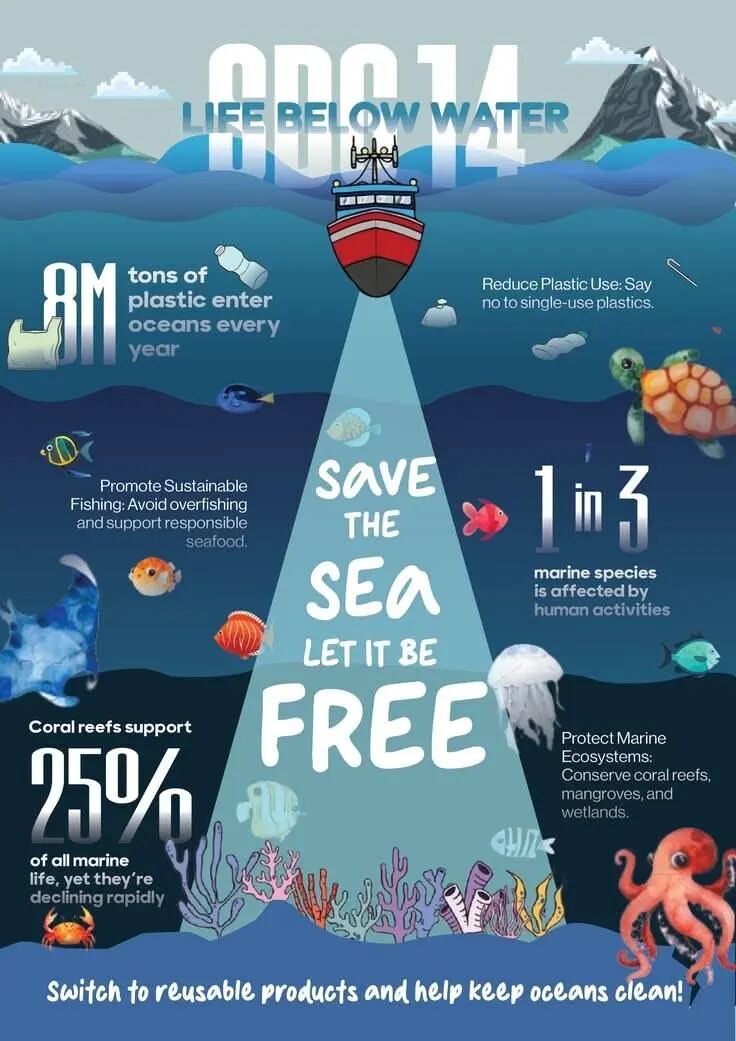
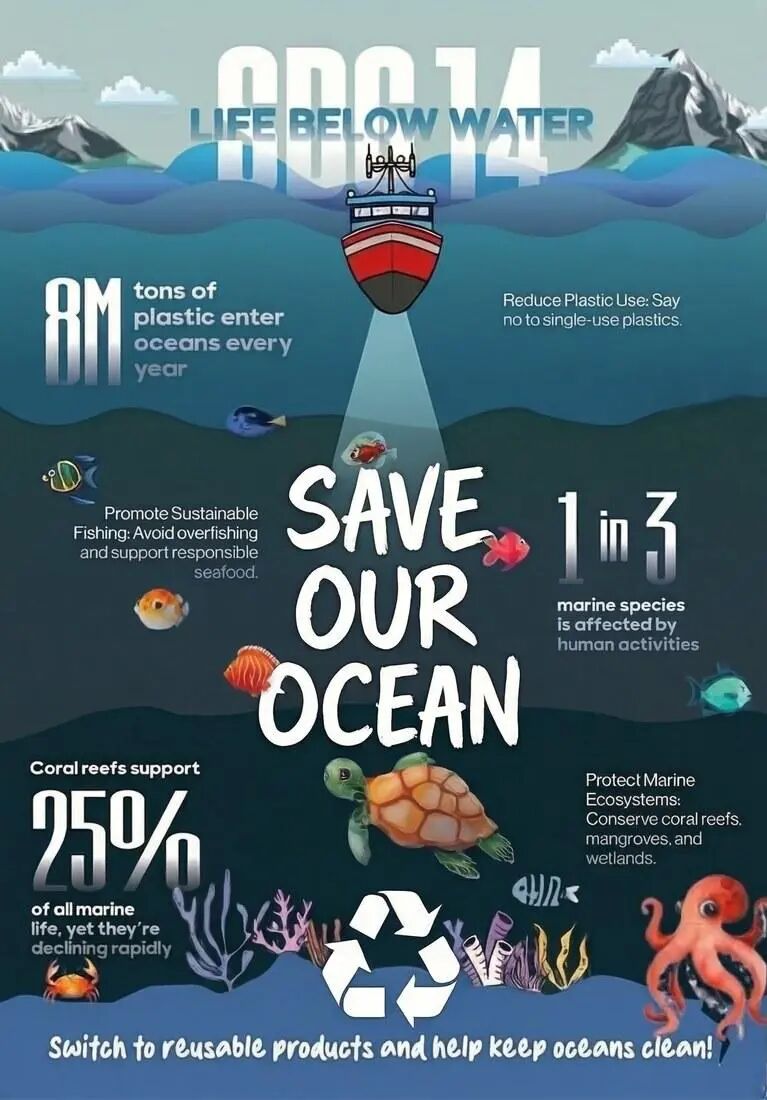
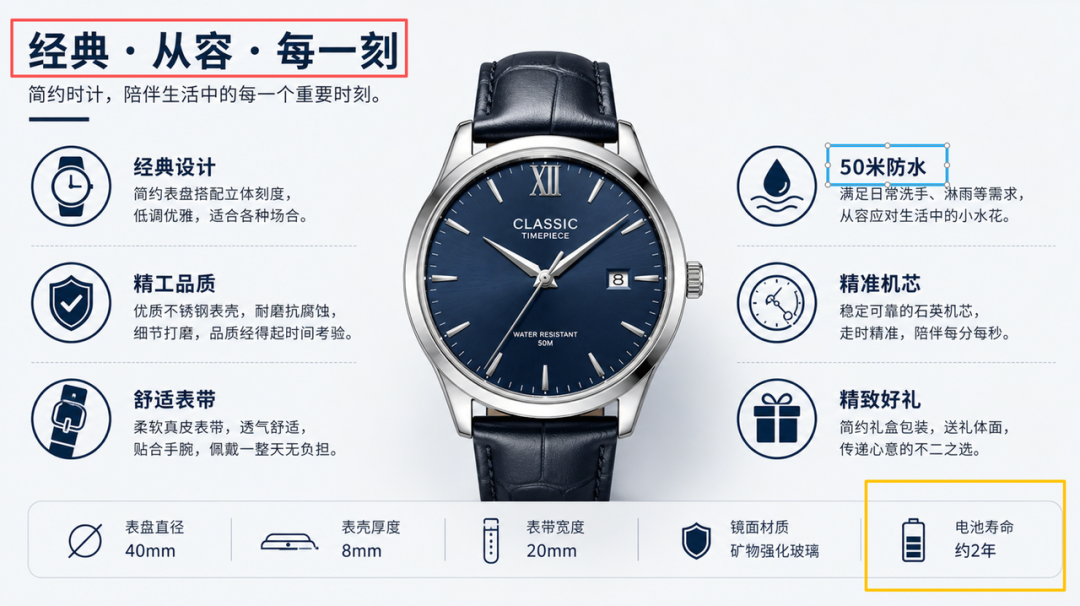
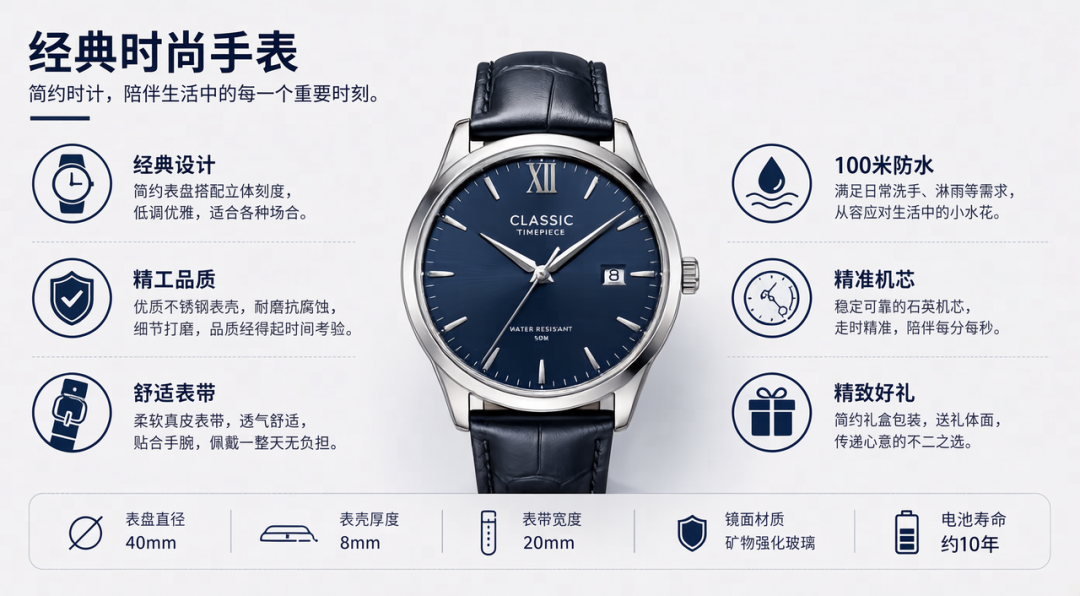
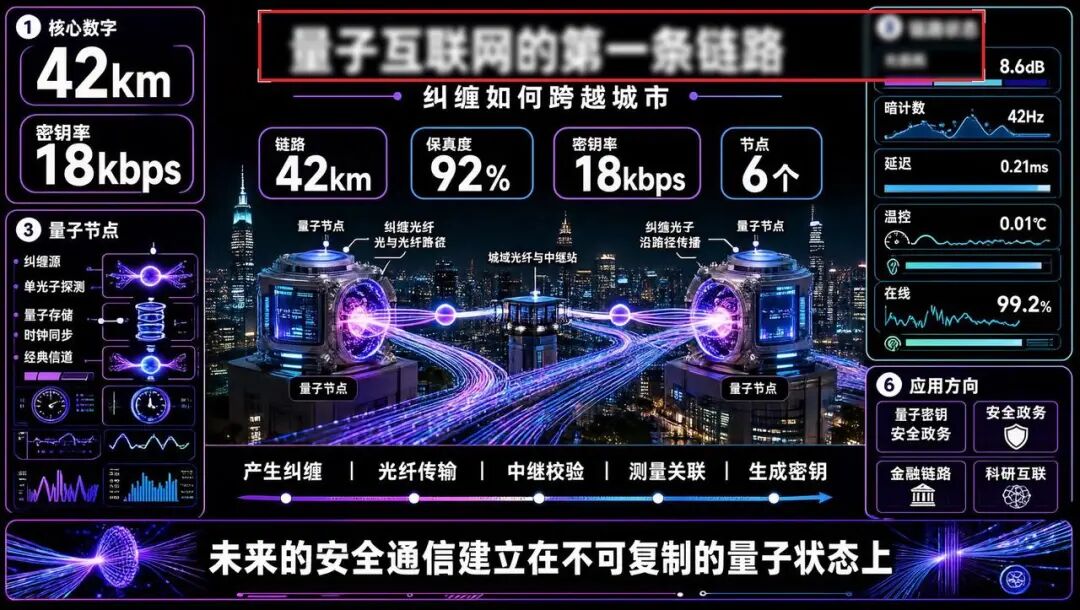
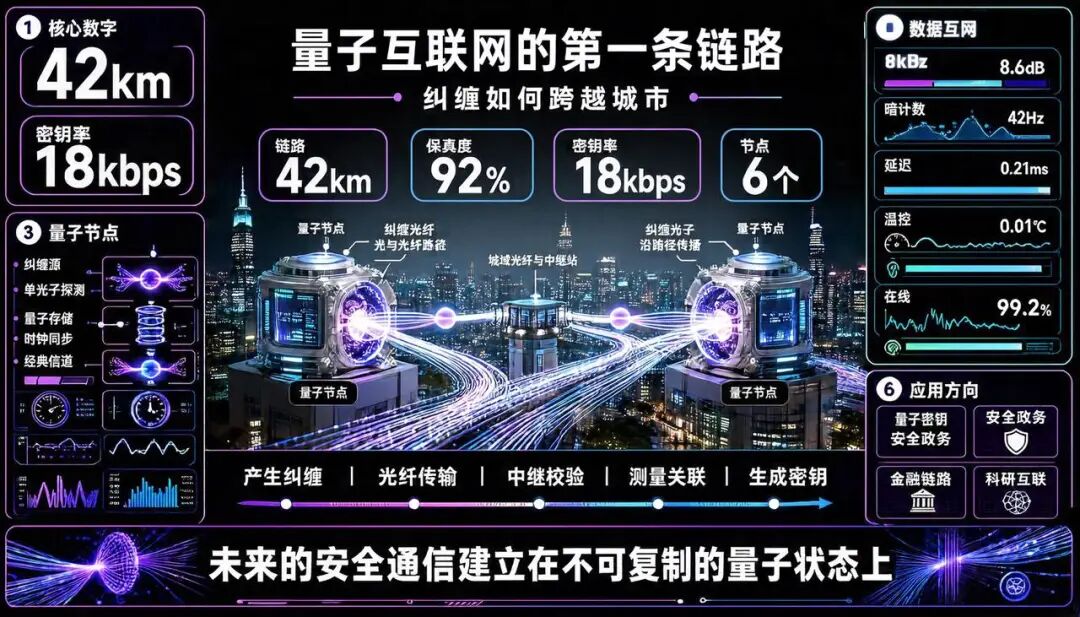

Editing via natural-language prompts
Beyond region annotation, you can specify the exact change directly in a prompt.


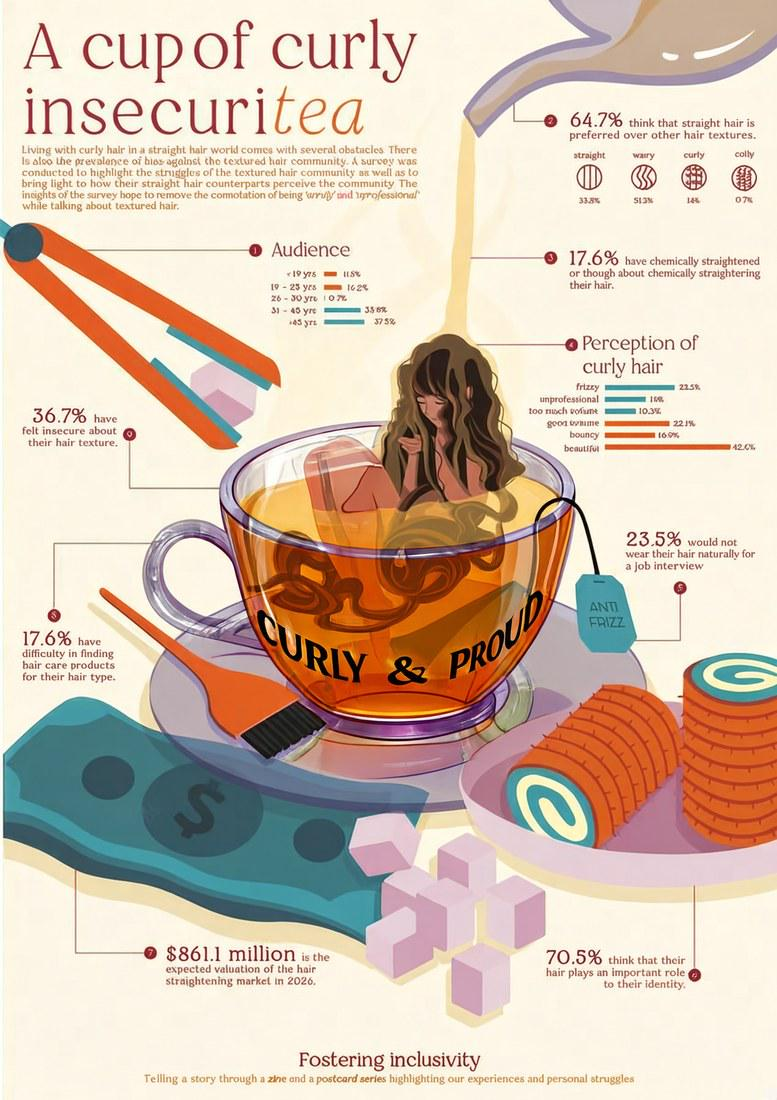
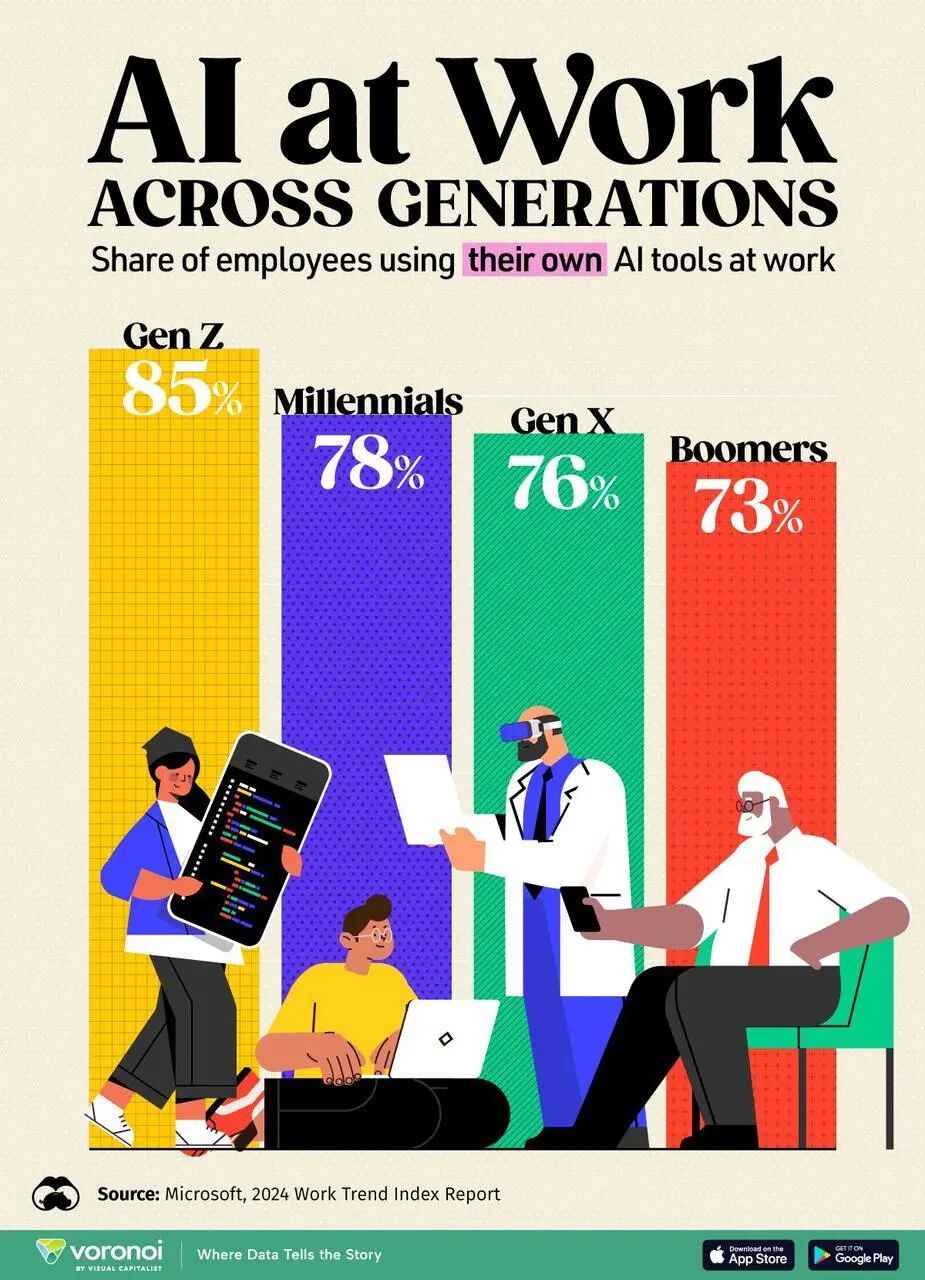
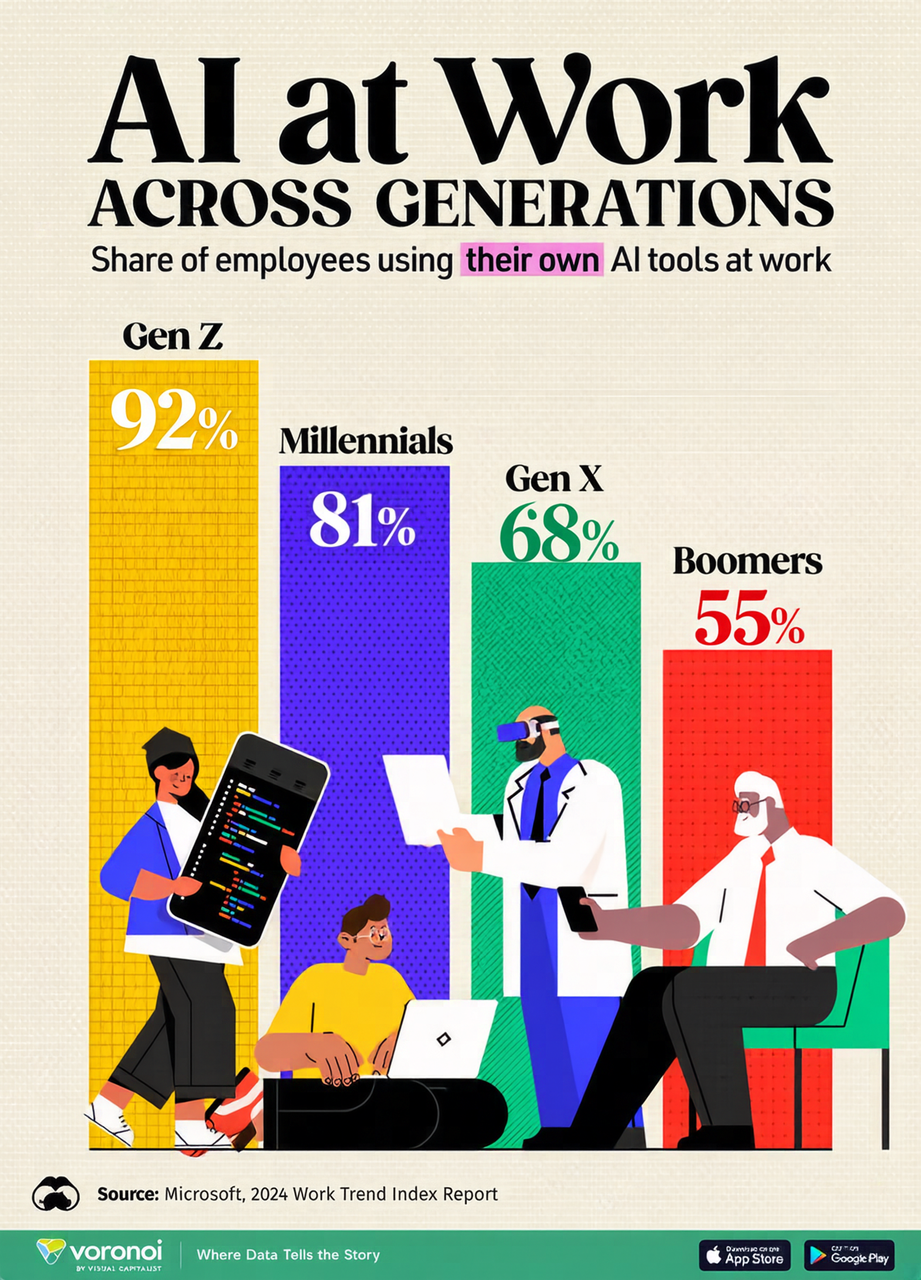
Local content editing
Beyond text, you can also rework local content you are not happy with.


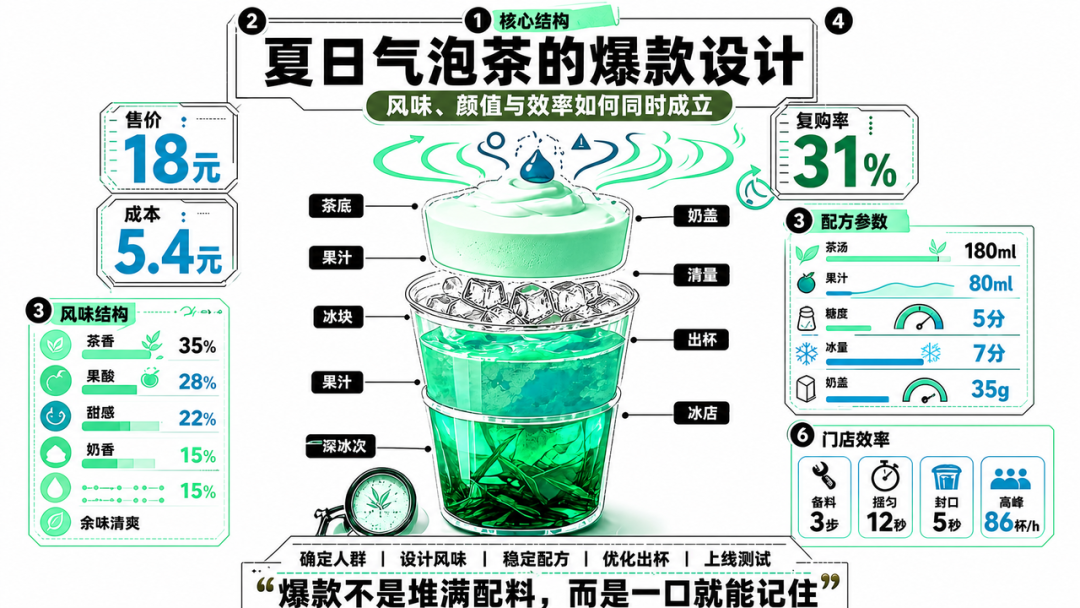
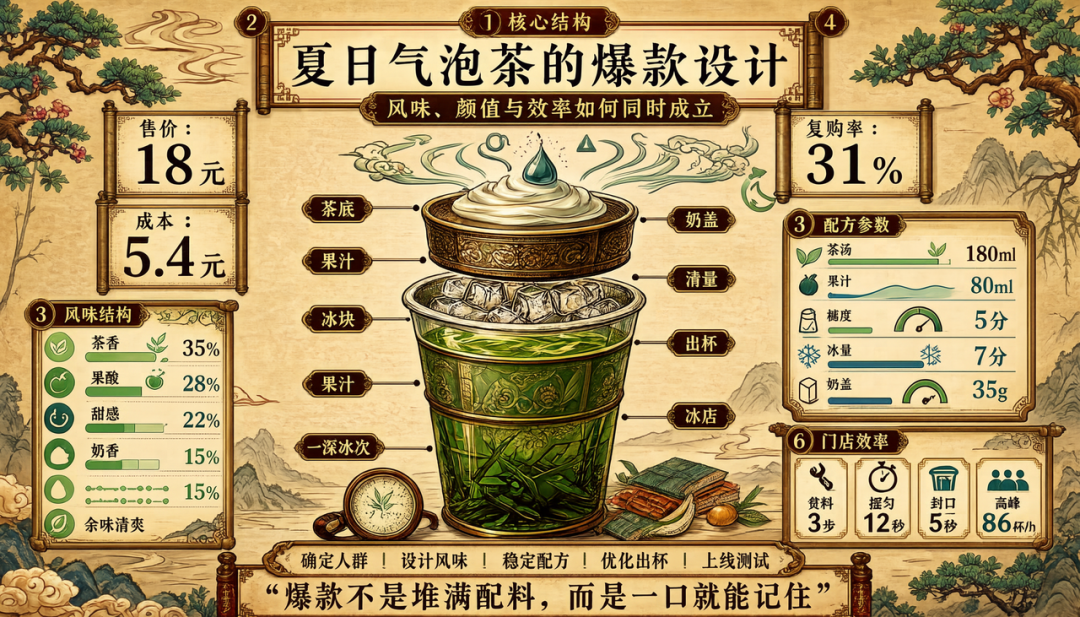
Global style editing
Infographic-V3 can also adjust the overall style of an infographic while keeping its core information and structure — letting the same content fit different brands, themes, and distribution scenarios.
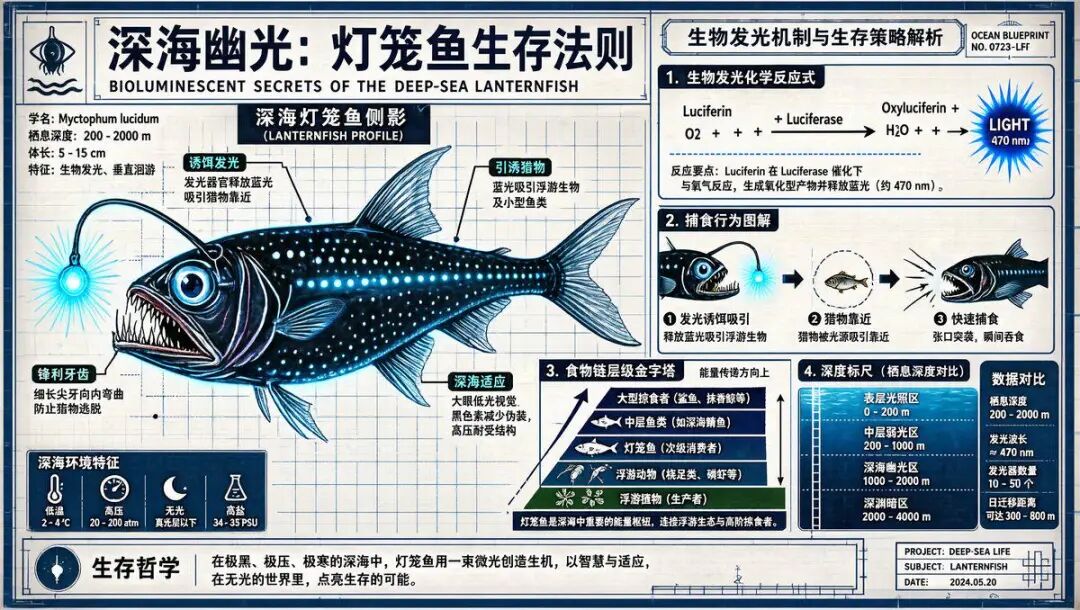
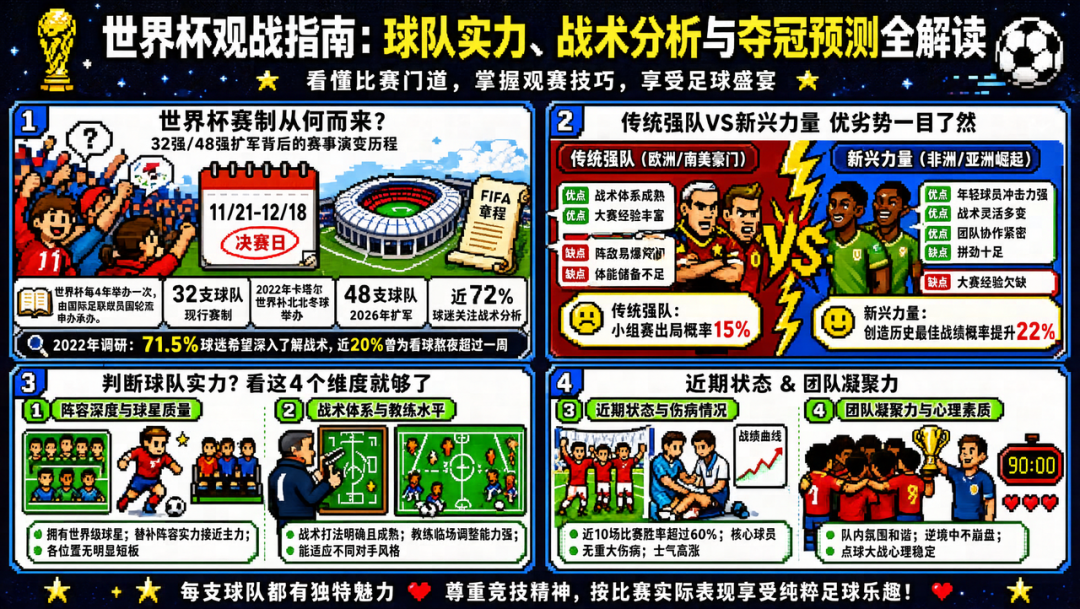
Global layout editing
It can reorganize content hierarchy and layout while preserving the core message, making the information clearer and adaptable to different sizes and use cases.
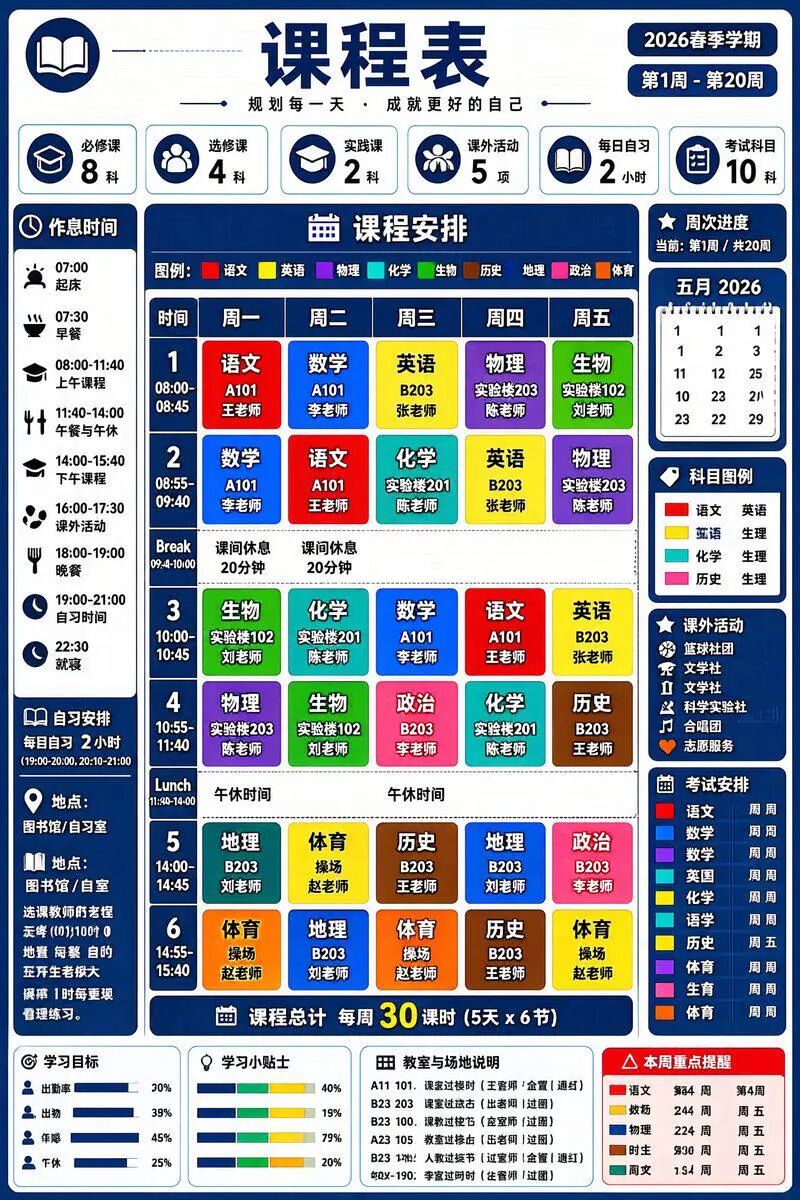
Generation ability is not sacrificed
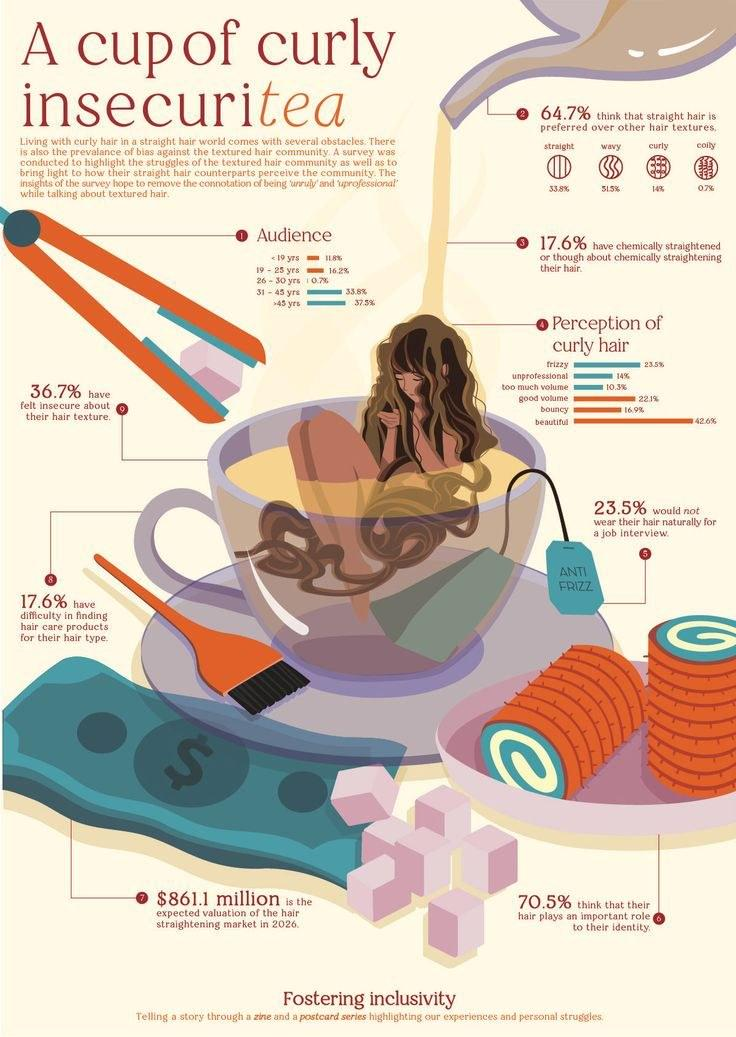
Crucially, adding editing did not come at the cost of generation. Infographic-V3 retains V2’s strengths in text-image fusion, complex layouts, and structured visual expression, and still handles high information density, intricate layouts, and diverse visual styles.
Trained from the mid-training stage for stable editing
To get stable editing, the team did not only tweak post-training; they went back to the MT (mid-training) stage and redesigned the training path. Around real editing needs they synthesized diverse infographic-editing data and jointly trained text-to-image and image-editing tasks in a fixed ratio. The model then proceeds through MT, SFT (supervised fine-tuning), and RL (reinforcement learning). Experiments show this joint training lets Infographic-V3 keep strong generation while gaining text and style editing — a step from “generate in one shot” toward “visually editable works.”
New editing benchmarks
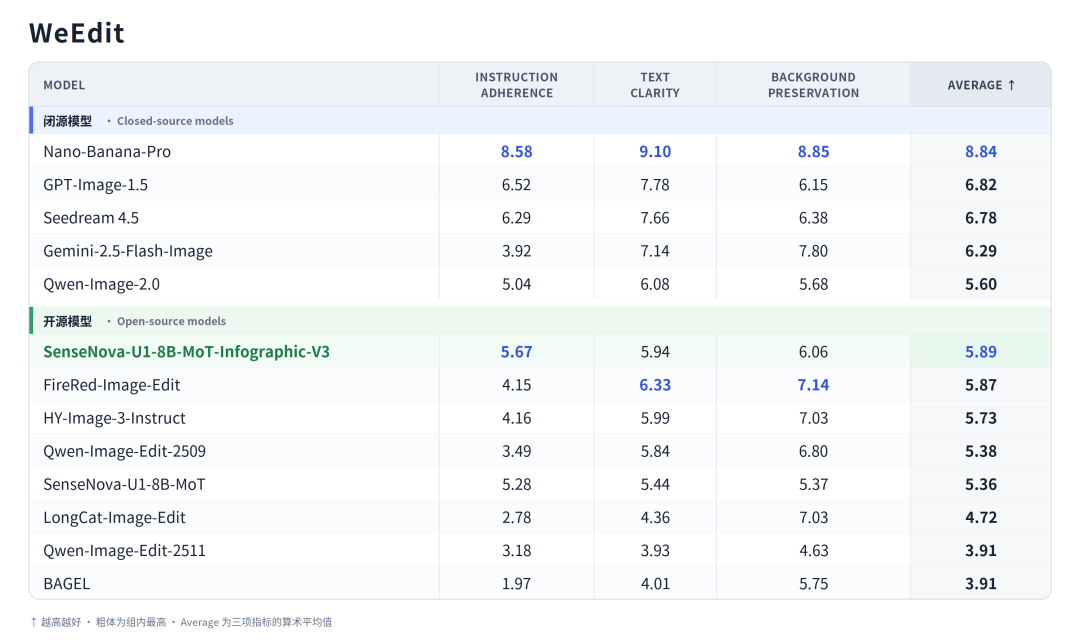
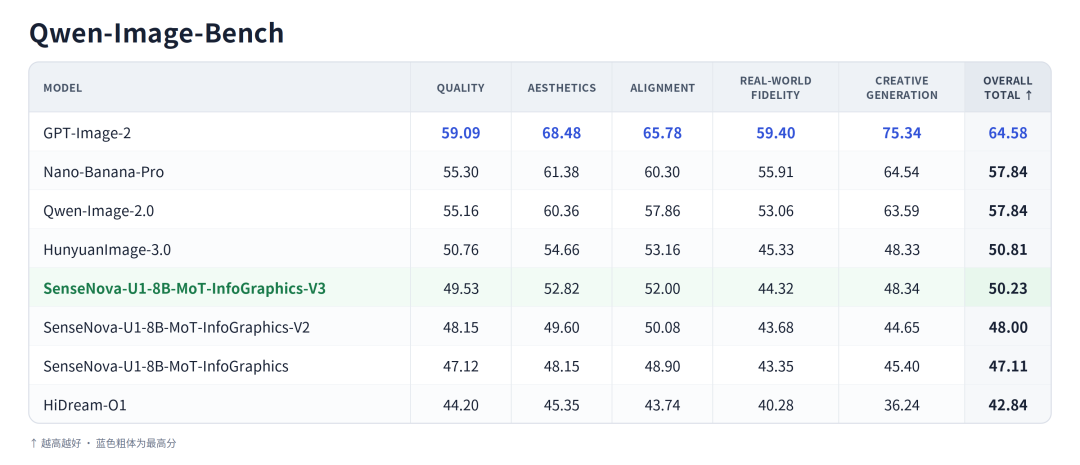
For the new editing ability the team added WeEdit, a benchmark dedicated to text editing, and adopted the recently open-sourced Qwen-Image-Bench for overall text-to-image evaluation. Infographic-V3 performs well on both, validating its text-modification, local-editing, and comprehensive image-editing skills, with steady gains in overall text-to-image ability. On WeEdit it scores 5.89 on average — the best among open-source models.
Next step: self-check, self-correct, iterate
Infographic-V3 already supports single-turn generation and single-turn editing for an integrated create-then-refine experience — but that is only the start. The SenseNova-U1 architecture natively supports interleaved text-image thinking, so the model may eventually check content and layout after generation, autonomously call its editing ability to fix problems, and optimize through multiple rounds. When generation, checking, and editing form a closed loop, infographic creation moves from “users re-rolling endlessly” toward “the model polishing the finished piece.”
Now open source
SenseNova U1 Infographic Enhanced V3 is now open-sourced globally. Creators and developers are welcome to download and try it, and to keep the feedback coming.
Model weights: Hugging Face
Docs: GitHub
ModelScope: ModelScope